Jump to:
Become Familiar With the Shape of the Graph
Strategy for Reading the Graph
More than One Graph in the Same Coordinate System
Before the braille reader starts to explore a tactile graph, briefly describe the graph verbally to give some useful clues. Remember to use the same mathematical vocabulary, common terms like horizontal, vertical, slope, perpendicular, parallel, intersection, maximum, minimum as the math teacher.
Become Familiar With the Shape of the Graph
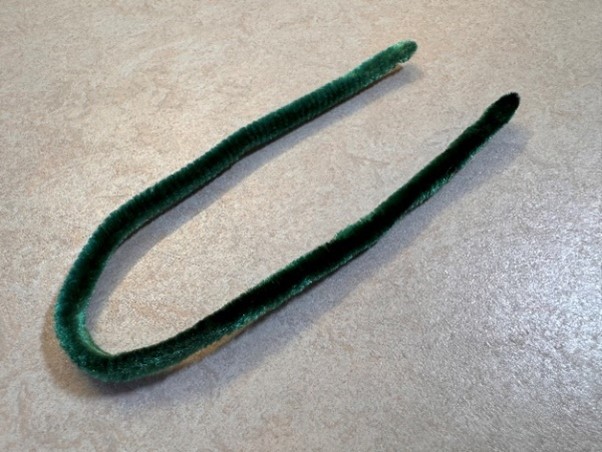
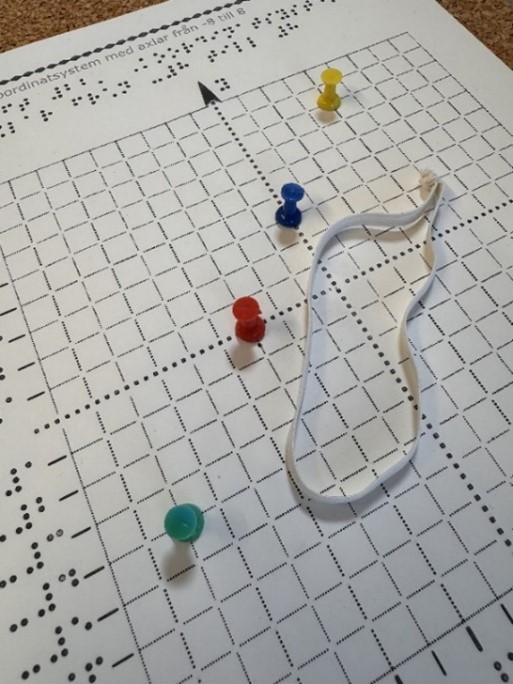
When introducing tactile graphs, we recommend that the braille reader first investigates a model or drawing of the graph without a coordinate system. Use a tactile drawing of the graph, a 3D print or create the graph using Wikki Stix or with different materials. It gives the student the opportunity to study the shape of the graph and avoids the risk of mixing the graph with the coordinate system.

When the student is well acquainted with both the shape of different graphs, and the layout of the coordinate system, it may be easier to recognize the graph in the coordinate system.
Strategy for Reading the Graph
As mentioned in the introduction, the braille reader should always start exploring a tactile drawing by passing both palms over the entire image area to get an overview of it. After this, the details can be studied with the fingertips. We recommend using a strategy, step by step, for the braille reader to get an overview of a tactile graph, for example:
- orientate the paper correctly (for example by identifying the north line)
- read the heading and legend
- determine the axes and origin
- determine which quadrants are displayed
- determine which numbers are along the axis and how much each step represents
- examine what type of graphs are displayed. Look for characteristics, such as intersections, maximum points or minimum points
Consider giving the braille reader confirmation while reading by naming the different parts of the tactile drawing. Use vocabulary such as x-axis, y-axis, gridlines, origin, quadrants etc.
Ask the braille reader to give a verbal overview of the image. It is also to check whether the braille reader has a good mental image of the picture.
Characteristics of Graphs
To know the different characteristics of graphs will help the braille reader to recognize them in the tactile coordinate system.
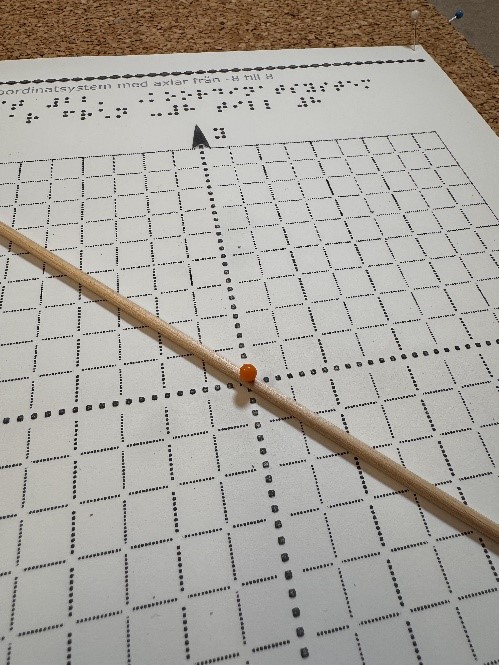
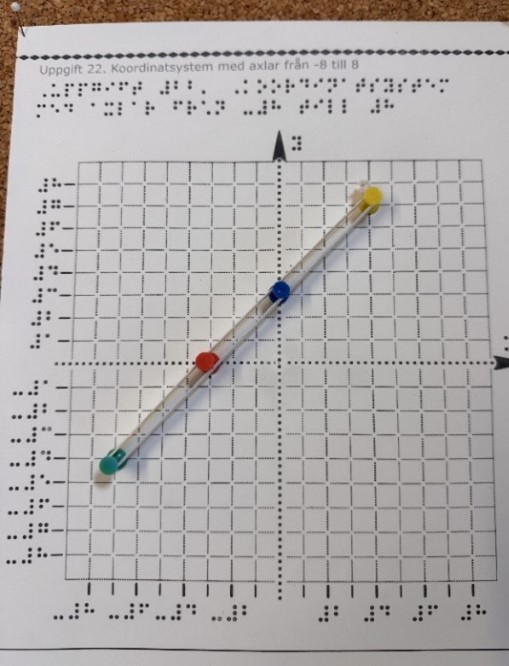
- Linear graph: To begin with, Wikki Stix, a pencil or similar can be used to represent a linear graph in a tactile coordinate system. Then use a tactile drawing and put some pins along the graph. Let the student put a ruler along the graph and decide if the ruler follows along the entire row of pins and the graph is linear. Use audible graph as a complement to understand the concept.
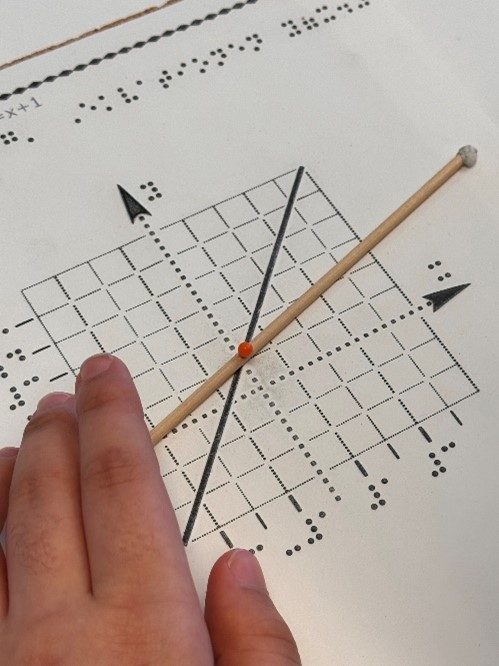
- Positive or negative slope: Use Wikki Stix, a wooden stick or a pencil to make different slopes in an image. Practice whether they have a positive or negative slope. Which leans more than the other? If it is challenging to understand that the slope is positive (increasing), the coordinate system can be set up instead of lying down on the table. The same strategy can be used for a negative (decreasing) slope. Use audible graph as a complement to understand the concept.
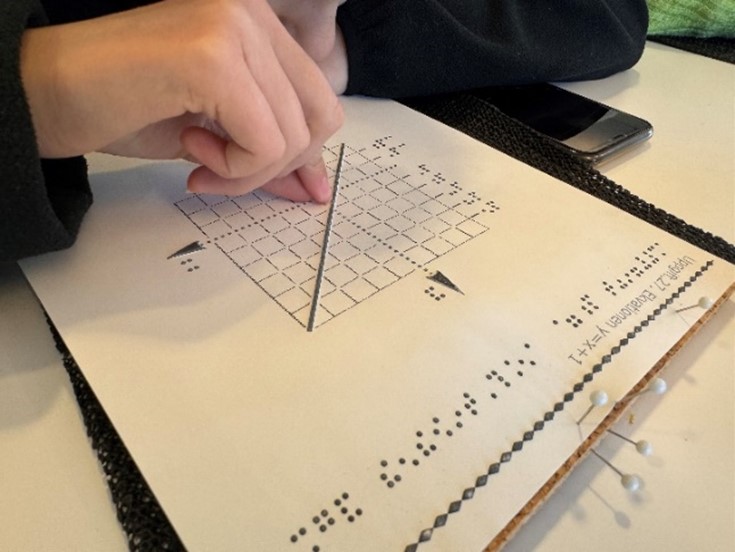
- Slope of a graph: Determining the slope graphically can be challenging but it can be good to try a few times to build up an understanding. Help the braille reader to select a suitable point on a line that intersects the grid in a clear point. Let the braille reader follow a square in the grid with the finger to the right or left depending on whether the line has a positive or negative slope. Then count the number of squares in the grid, up or down, before reaching the graph again.
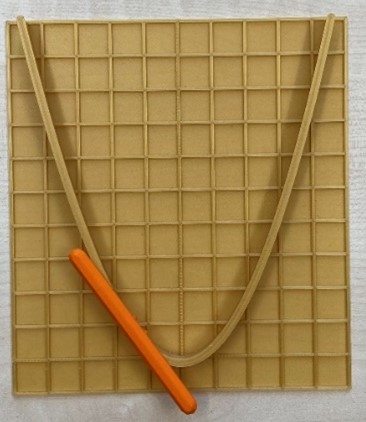
Compare different functions and how a parameter can affect the slope of the line. For example: “Illustrate with the Wikki Stix what happens when the slope (or the value of a in y = ax + b) increases”. - Parabola: When introducing a parabola, use Wikki Stix or a flexi curve in a tactile coordinate system without gridlines. Let the braille reader study different graphs. Then let the braille reader practice tactile images that show a standard parabola to gain an understanding of the characteristic.
- Symmetry: Make sure that your braille reader understands the concept of symmetry in a parabola. In the beginning it may be useful to add pins or a Wikki Stix on the symmetry line of the parabola. Another option is to cut out the parabola from paper and let the braille reader explore. Fold the paper to highlight the symmetry line.
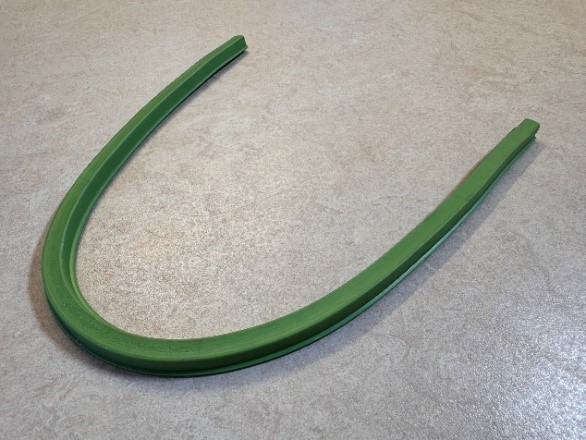
- Tangent of the graph: To explain how the slope of the tangent changes as the tangent moves along the graph, we recommend using some concrete material. The 3D-printed tangent will be useful to demonstrate this.
More than One Graph in the Same Coordinate System
When there are several graphs in the same coordinate system, the braille reader must be familiar with the shape and characteristics of each graph first. Use a coordinate system without gridlines and add the graphs one by one. Consider to first create the new graph with Wikki Stix to make it easier for the student to separate the graphs.
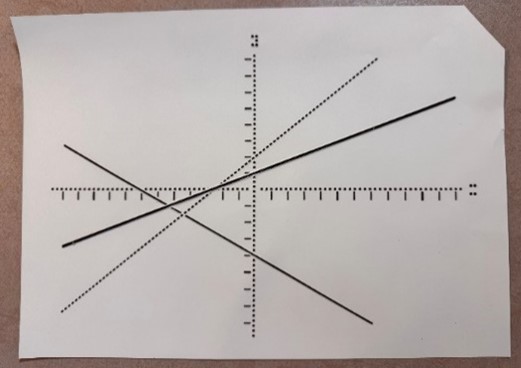
When the braille reader is familiar with all the graphs, studying the tactile drawing of them in a coordinate system without gridlines becomes possible. Let the braille reader investigate how the graphs are located in relation to each other and locate possible intersection points.
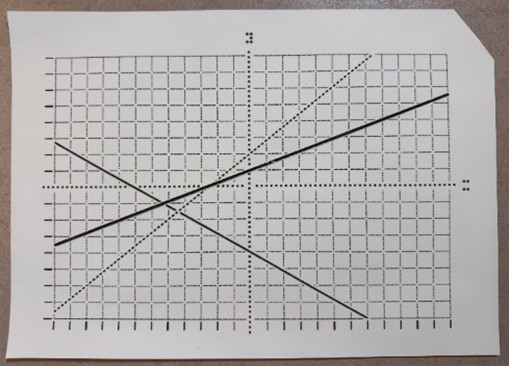
After this the braille reader can investigate the graphs in a coordinate system with gridlines and numbers. Remember that the number of graphs in the same coordinate system should not be more than three. If there are more graphs it may be impossible to separate them.
How to Draw or Sketch a Graph
In teaching, different methods can be used to draw a graph. Creating an accurate graph can be difficult and often not possible. But the braille reader needs to be given the opportunity to practice strategies for making a sketch of a graph. It is a big win because the student gains an increased understanding of the concepts of function and graph when working on the sketch, step by step. To save time and energy the student may need some assistance, and it is important to select appropriate tasks and limit the number of tasks
Instead of letting the braille reader make the graph themself, a more efficient way to understand how graphs are produced out of several coordinates is by doing it together with the student. The professional in tactile reading can be the one marking the coordinates and later combine them to a tactile graph.
This could be done in active communication, with the student sitting beside the professional while producing. The braille reader can simultaneously feel how the graph evolves from all the coordinates. In this way the student can focus on the understanding of the transformation from points selected from a certain function to a graph.
When marking coordinates on a tactile coordinate system, it is preferable that the tactile markings are small and close to the tactile background. This makes it easier for the braille reader to feel the shape of the graph.
It is advantageous to place the tactile coordinate system on a soft board. Wikki Stix is the best option for connecting the points in a tactile coordinate system as they stick to the surface. You need to be aware that it still can be challenging for the braille reader to connect the pins independently with Wikki Stix. The needles in the points can then be removed, making it easier for the student to perceive the shape of the graph. To make the Wikki Stix adhere better, they can be pressed by rolling them with a round object such as a pen.
Instead of calculating many points, let the braille reader find central points of the function and mark them. It will make it easier for the student to understand the connection between function expressions and graphs, in addition to saving time:
Linear functions
- Mark the point of intersection with the y-axis.
- Count units using the gradient, for example if the gradient is 2, count one step in the x-direction from a point on the graph. Then count two steps in the y-direction and mark this point.
- Mark the intersection with the x-axis.
Quadratic functions
- Mark the zero points and intersections with the y-axis.
- Mark the maximum or minimum point.
- Draw in the axis of symmetry and mirror points about it.