A Stripped Coordinate System
A simplified coordinate system, known as a “stripped” coordinate system, does not inculde a grid or numerical labels on the axes. It can be produced in both tactile and print formats. This design enhances tactile recognition of the general positions of points and lines in graphs by eliminating the distraction of braille gridlines and numerical markings. Therefore, it is particularly beneficial for braille readers.
The stripped coordinate system comes in two variations: with and without tick marks on the axes. Normally, coordinates are provided on the axes, and students are required to either plot or read the location of a specific point. With the stripped coordinate system with tick marks, it is also possible to provide the coordinates of a point and challenge students to determine the numerical values on the axes.
We initially introduced stripped coordinate systems to facilitate the exploration of graphs through the sense of touch. Interestingly, we observed that using this coordinate system also encourages braille readers to adopt a more structure-oriented approach when solving mathematical problems. As a result, we recommend that teachers use this coordinate system for all students. This serves as a noteworthy instance of reverse adaptation, where the teaching and learning experiences of braille readers inform and enhance the adaptation process for everyone.
- The point in figure 1 is located at (-3; 3) or (3; -3). Which answer is correct?

1: A coordinate system with a point - The point in figure 2 is located at (1; 2). Determine the step sizes on the axes.

2: A coordinate system with a point
Note: It may be difficult for a braille reader to locate the position of a point when there is no grid. In that case, you have to add a grid or ask the professionals in tactile image reading for support.
Coordinate System With Adjustable Axes
Typically, students start by drawing or printing a coordinate system and then proceed to plot points or graph lines within it. Here, we want to introduce a very different — almost inverse — method using a “coordinate system with adjustable axes”. In this approach, we start with a (tactile) drawing and then add the coordinate system to it. You move the axes in such a way that you achieve the desired coordinate points or graph. For example, consider a (tactile) drawing of a parabola that has the same shape as the parabola with the equation y = x^2. By adding the coordinate system to it and adjusting the axes, you can create many different parabolas: y = x^2, y = x^2 ‐ 2, y = (x + 1)^2 + 3 etc. By flipping the sheet over, you can also create mountain parabolas, such as y = ‐x^2 and y = ‐x^2 ‐ 3. For additional support, you can use a drawing on a tactile grid, which makes it easier to adjust the axes and identify the coordinates. Ensure that the grid matches the scale on the axes.
This coordinate system with adjustable axes is an excellent tool for teaching and learning about translation, as it makes the process easy for both teachers and students. It is also highly sustainable because one drawing can be used in many different contexts. Transitioning from a fixed to an adjustable coordinate system can enhance understanding of graphs for all students, whether visually impaired or not, and thus serves as a noteworthy example of reverse adaptation.
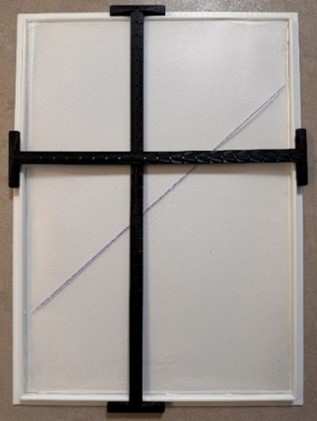
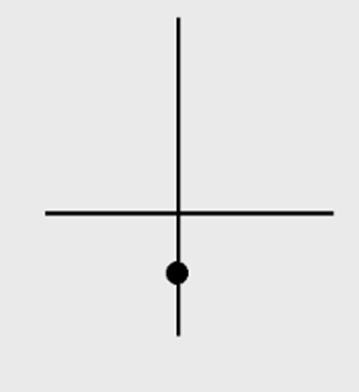
A tangible point on a blank sheet of paper can be positioned at coordinates (0; -1) by adjusting the axes of the coordinate system in a manner that situates the point along the y-axis, just beneath the origin.

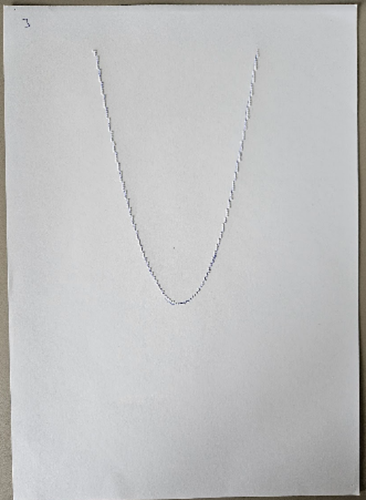
- Start with a drawing of a parabola on a blank sheet of paper (figure 1).
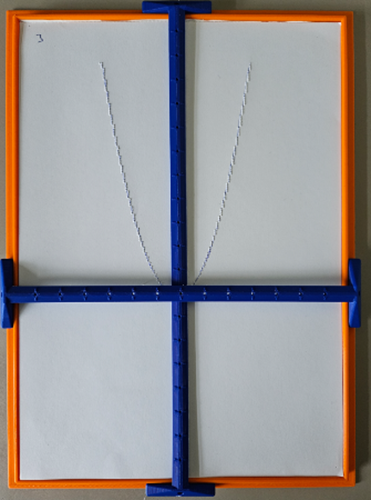
- Add a coordinate system and move the axes in such a way that the parabola with equation y = x^2 appears (figure 2).
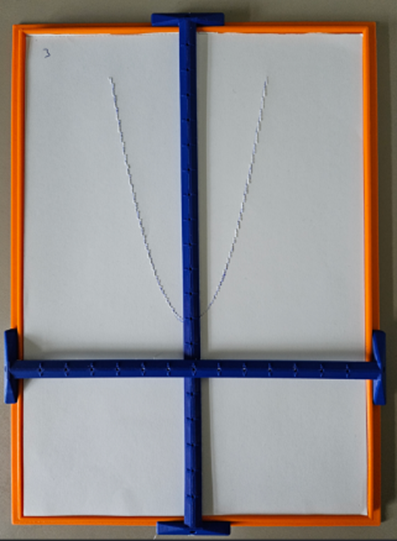
- Move the y-axis to the right to create the parabola with equation y = (x + 2)^2 (figure 3).
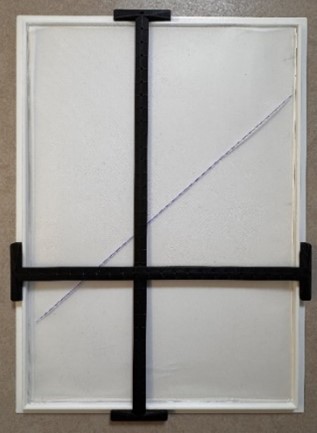
- Move the x-axis down and move the y-axis to the left to get the parabola with equation y = x^2 + 2 (figure 4).