Jump to:
Tactile Flowcharts
A flowchart is a visual sequence of actions or things in a system with a certain beginning and endpoint(s). It serves in decision-making processes or determining output based on specific input and provides a foundation for developing pseudocode, code, or programs. Due to the challenges of drawing and reading, braille readers require alternative methods when learning about flowcharts. Building an overview of the flowchart will be difficult for the braille reader. Practicing flowcharts is therefore mainly helpful for a braille reader when learning about the structure of a process and not for exploring all the details.
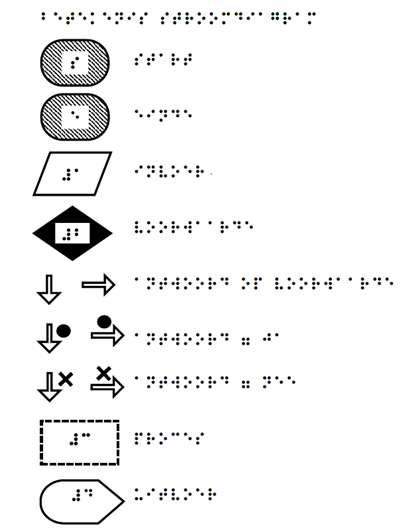
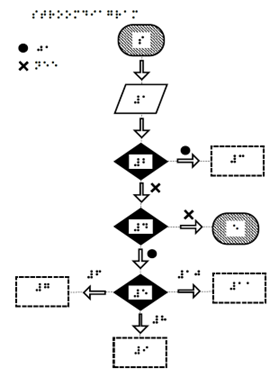
When introducing flowcharts to a braille reader, it is advisable to use tactile materials. Tactile flowcharts play a crucial role initially, aiding the braille reader to develop mental representations of a process. Before delving into creating and interpreting flowcharts, braille readers must memorize all shapes and abbreviations, a skill that can be trained in collaboration with a tactile image reading professional. The image below shows all the shapes and their meaning. Also, the student can keep this overview page when working with flowcharts. You can find the page in the download section.
Below is an image of a template that allows teachers to easily build their own flowcharts that work well with braille students. The template consists of a Word document with all the possible shapes and some braille. Different versions of the template can be found in the download section. This braille can be added to the shapes to number the shapes. Leave enough space between the different shapes. Make sure the text is always closer to the box or arrow that it belongs to than other shape near. After designing the flowchart, these can be printed and swelled. The numbers on the flowchart can correspond to a text document containing more explanations about the flowchart.
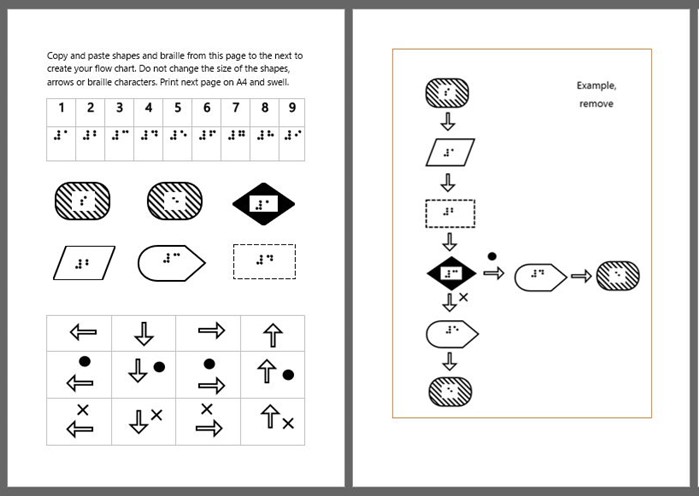
The following text corresponds to the example of a flowchart on the right:
s: start
1: input: all marks that a student received for mathematics this year
2: process: add up all the marks and divide this number by the number of marks, this is the average
3: conditional: is average greater or equal to 5,5
dot: yes
4: output: you passed
e: end
cross: no
5: output: you failed
e: end
Always make the flowchart in such a way that the student can follow it from top to bottom. Tell the student to first explore the whole flowchart with both hands from top to bottom. Following, it could be helpful to give a verbal description of the tactile flowchart to help the braille reader to get an overview. The following is a verbal description of the example in the figure above:
After the start, you will find the input, followed by a conditional. The answer to this conditional can be either yes or no. Here the flowchart splits in two directions. Both directions consist of an output and then end.
It is possible to let the students make flowcharts themselves. Make sure the shapes are the same as in the tactile images that you presented before.
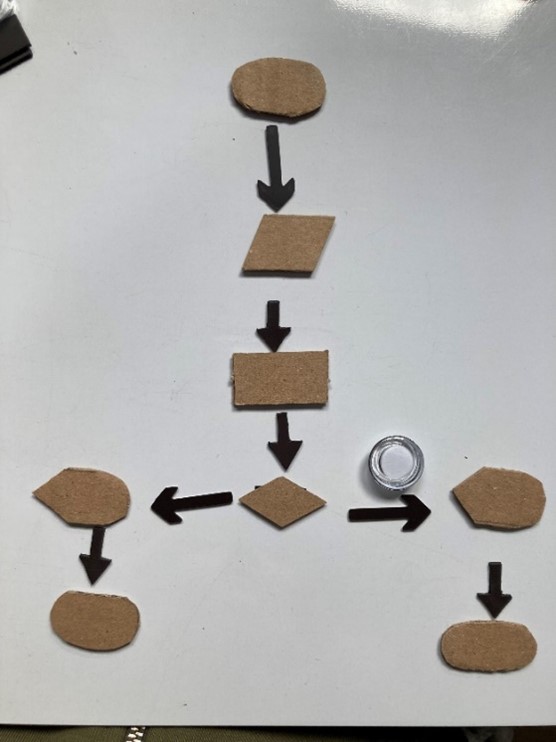
Making flowchart materials from cardboard is easy. They can also be created with a 3D printer, 2,5D printer or laser cutter. If you use materials that are magnetic, or use magnetic tape, and place the pieces on a magnetic board, the flowchart will stay in place. When making a tactile flowchart, make sure the shapes are always the same shape and same size. Adding small braille annotations on top of each symbol enhances symbol recognition for braille readers.
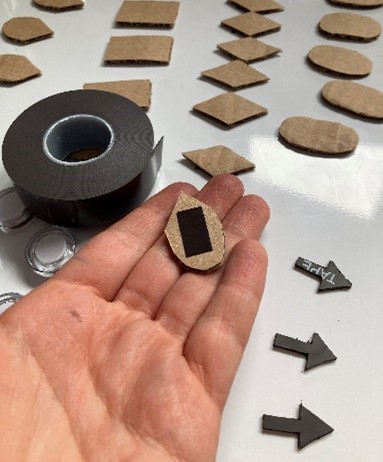
If possible, use different structures for the different tiles, to make it easier to discriminate between the shapes.
It is also possible to use a readymade 3D model for flowcharts, using these printing instructions.
From Flowcharts to Pseudocode
When the braille reader has practiced tactile flowcharts, it may be appropriate to transition reading and writing them in pseudocode on the computer. When introducing a pseudocode, the teacher may need to break down the visual structure of a flowchart to a text document. Remember to always write a number list when making the flowchart in text. The advantage of a text document is that it goes quite fast and is easy to read through for a braille reader. However, the textual flowchart/pseudocode does not give the same overview of the process as the tactile flowchart because it does not contain the structure of a tactile or visual flowchart. Text-based pseudocode offers the additional benefit of enhanced communication, making it easier to convey ideas to others. Moreover, the transition from text-based pseudocode to actual programming code will be smoother.
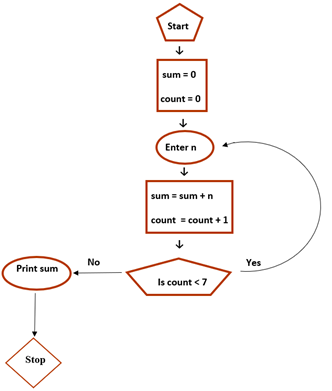
1. Initialize sum = 0 and count = 0
2. Enter n
3. Find sum + n and assign it to sum and then increment count by 1
4. Is count < 7 go to step 2
Else Print sum and stop
Regardless of how the flowchart is constructed, it is important for the mathematics teacher to be aware that it is more challenging for the braille reader to get an overview of the flowchart than for the other students, and it takes time to gain an understanding of the entirety of the flowchart. Exploring the flowchart before class with a tactile image reading professional could be helpful.
Exercises
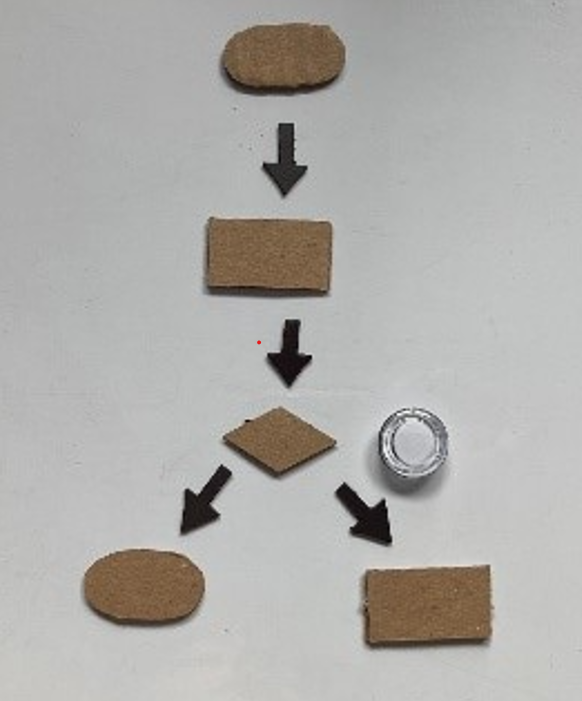
Create a flowchart out of cardboard material for the following situation. You have had two grades for a subject. Your program must decide whether the average of these two grades is a pass (=>6) or a fail (<6).
Preparations: Create suitable flowchart shapes (see the Learning Resources for more information).
A possible solution to this exercise is the following flowchart:
First read the tactile flowchart, then try to finish the flowchart by filling in the gaps (between the brackets) in the text below. The flowchart is about making a strategy for determining the length of a side of the right-angled triangle. The numbers and letters in the text below correspond to parts of the tactile flowchart.
s: start
1: input = right angled triangle
2: are two sides of the triangle known?
3: [ ]
4: are at least one side and at least two angles known?
e: end
5: [ ]
6: opposite and hypotenuse
7: [ ]
8: adjacent and hypotenuse
9: [ ]
10: [ ]
11: use the tangent function
Solution:
s: start
1: input = right angled triangle
2: are two sides of the triangle known?
3: use Pythagorean theorem
4: are at least one side and at least two angles known?
e: end
5: looking from the angle that is not straight, which sides are known/ do you want to know?
6: opposite and hypotenuse
7: use the sine function
8: adjacent and hypotenuse
9: use cosine function
10: opposite and adjacent
11: use the tangent function
This is an example where all students can work with a flowchart in text.
Choose two integers x and y. Can you work out what this procedure does? Can you prove that the algorithm will always work?
Preparations: Create an adapted textual flowchart instead of the visually represented flowchart.
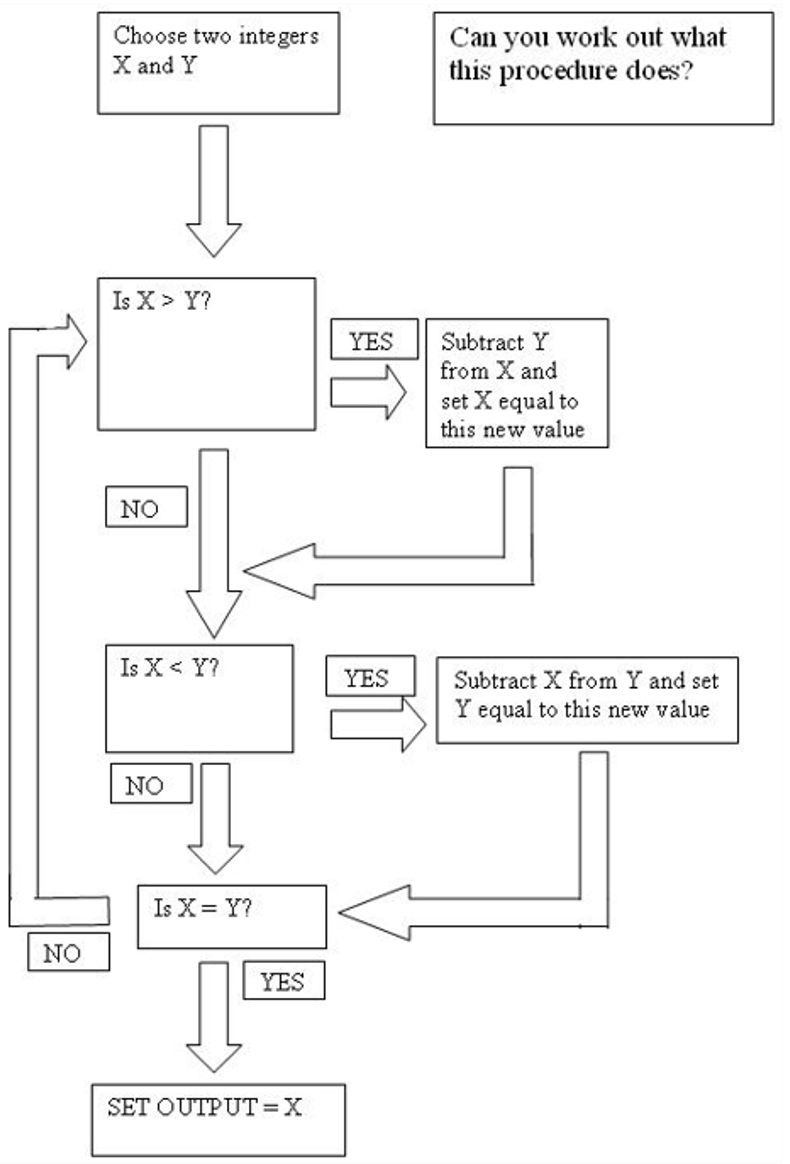
Textual flowchart corresponding to the visual flowchart above:
- Choose two integers x and y.
- Is x > y?
- Yes: Go to 5.
- No: Go to 6.
- Subtract y from x and set x equal to this new value.
- Is x < y?
- Yes: go to 9.
- No: go to 10.
- Subtract x from y and set y equal to this new value.
- Is x = y.
- Yes: Go to 13.
- No: Go to 2.
- Set output = x.