Jump to:
Inserting Tables Into a Document
Navigation and Screen Reader Settings
Ensure that the braille reader understands how a table is structured with rows and columns. A tactile table printed on paper, which also shows the lines of the table, can facilitate understanding. This grid does not appear on the braille screen when reading tables on a computer.
The table of values is written vertically, with the x-values and the corresponding y-values on the same line. This allows the student to see the x- and y-values on the braille display at the same time.
Tables on the computer can be created in a number of ways. Below are both a simplified method of creating a table and the use of Microsoft Word tables.
Simplified Tables
A simple table of values for a braille reader can be created by using two spaces or a semicolon to mark a new column. This way the student doesn’t have to insert a table and navigate between cells to enter or read values. Reading and writing a table in this way can be more efficient and timesaving for the braille reader.
When presenting a table to the braille reader, start by giving information about the number of columns and rows in the table:
{Table: 2 columns, 8 rows}
x y
-3 10
-2 5
-1 2
0 1
1 2
2 5
3 10
A blank line after the table of values indicates the end of the table. You can also write “End of table”.
Inserting Tables Into a Document
In Word and other document programs, tables can be created by inserting a table from the menu bar of the program. An inserted table not only provides visual clarity, but also provides a more structured way for the braille reader to navigate within the table.
Teach the student how to create a table using keyboard shortcuts. The table doesn’t have to have the correct number of rows to begin with. Pressing the Tab key while in the last cell of the table will add a new row. Alternatively, you can use Shift + F10 while in a cell and navigate to Insert to add a row or column before or after the current cell.
Navigation and Screen Reader Settings
The braille reader should have speech synthesis enabled when using the screen reader in tables. The screen reader notifies the user when they enter a table, both by speech synthesis and on the braille display. The braille display will show information about the active cell along with the row and column of that cell. If the table has been set up correctly for accessibility, the braille reader will also receive information about the headings of the active cell.
To navigate within the table, use the arrow keys or the Tab key to move between cells. The difference is that the Tab key selects the content of the cell, which means that if you press any key other than the Tab key, the contents of the cell will be deleted. To quickly navigate between cells within a table, you can also hold down Ctrl and Alt keys while using the arrow keys (up, down, right, and left).
By default, most screen readers display only one cell at a time on the braille display, which can make it difficult to get an overview, understand the layout, and navigate around the table. You can configure screen readers to display an entire row (or column) on the braille display, or as much as will fit on the display.
For Jaws, access the JAWS Quick Settings dialogue box (Insert + v) and type “table” in the search box. Then navigate to where you can change settings for displaying rows or columns. You can also change the settings for announcing column headings as you move around the table.
| x | y |
| -3 | 10 |
| -2 | 5 |
| -1 | 2 |
| 0 | 1 |
| 1 | 2 |
| 2 | 5 |
| 3 | 10 |
For the table above, the following information is displayed on the braille display. In this case, the settings in JAWS Settings for Tables have been set to display the values for the row and the heading for the column in which the cursor is located:
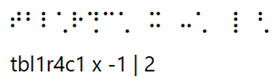
The information is as follows: You are reading the first table in the document, identified as “tbl1”. The cursor is on a cell in the fourth row, labelled “r4”, within the first column, labelled “c1”. The heading for the first column is “x” and the cell contains the value -1 (“-1”). A new column in the same row is denoted by the symbol “|” and contains the value 2 (“2”).
Table of Values in Excel
If the braille reader is familiar with Excel, the program can be used to read and create a table of values. If not, it is up to the ICT professional to make the student familiar with Excel.
It is recommended to use a single table within a spreadsheet, starting from cell A1. However, a disadvantage of using Excel is that the tables are in a separate document from the Word file where the braille reader accesses tasks and records the solutions. This can create a separation between the content and the mathematical work being done, which may require additional navigation between documents.