Jump to:
Coordinate Systems
Utilizing Quadrant Numbers
We strongly recommend math teachers to teaching quadrant numbers to all students, whether visually impaired or not. Knowledge about the quadrant numbers both helps students form a mental framework of the coordinate system and enhances effective communication.
Coordinate System Exploration
Braille readers need support in examining the coordinate system using their fingertips and the insides of their hands. It is crucial to clarify which components of the coordinate system are significant and why. Additionally, it is important to suggest a sequence for finger movement, as this can vary.
This approach is actually very helpful for all students. Teachers often assume that sighted students perceive visual concepts, such as axes and gridlines, in the same way as they do. This is not always the case. Therefore, it is important to explain to all students how to explore a coordinate system, whether with their fingertips or their eyes. This approach is a good example of reverse adaptation.
Accuracy in Reading and Plotting Points in Coordinate Systems
Braille readers are not subject to the same demands for accuracy as students who can see, and it is more time consuming for them to understand elements in a coordinate system. Discuss this with the professional in tactile image reading. If necessary, this professional can provide additional support to the braille reader.
Graphs of Functions
Reading Tactile Graphs
An often-used alternative to visual graphs is a tactile graph, which requires exploration and comprehension using the palms or fingertips. Despite the tactile graph’s visual resemblance, perceiving it through touch differs significantly from visual perception. When using the sense of touch, it is necessary to construct an overview. The inner surfaces of the hands provide information about the graph’s location, such as its placement in quadrants. Fingertips allow for the detection of finer details, such as the x-coordinate of a point. Practicing with tactile graphs often occurs during pre-teaching sessions. Some fundamental guidelines for tactile images include not representing more than three graphs in a single coordinate system, using gridlines only when nedessary, ensuring that the texture of gridlines, axes, and graphs are distinguishable by touch, and avoiding redundant information.
If a braille reader finds it difficult in obtain an overview, it may be helpful to provide two versions of the tactile graphs: one with a simplified coordinate system (without gridlines and numerical labels on the axes) and one with a regular coordinate system. The first drawing helps to get a quick overview, while the second drawing offers more detailed information.
Verbal support, whether written or oral, should always accompany tactile graphs. This support complementsand reinforces the information presented in the tactile drawing. It is essencial that the verbal support uses accurate mathematical vocabulary. This also extends to expressing mathematical formulas, for example, using “x squared” instead of “x circumflex 2”.
Creating Tactile Graphs
It is important for braille readers to gain experience in this process of creating tactile graphs themselves, as it enhances their understanding of the graph’s characteristics. To create a graph, a braille reader must have access to a table or a function expression. This requires proficiency in reading braille and interpreting values in a table. For more detailed information, please see the instructional guides for tactile image reading professionals, for braille professionals, and for ICT professionals.
Audible Graphs
An alternative way to interpret graphs involves the use of sound, by using Desmos. Desmos offers an auditory representation of a graph’s shape. While navigating the graph with the keyboard’s arrow keys, Desmos can provide information about significant points. Screen readers can convert the text into spoken output or braille. However, it is worth noting that Desmos primarily employs mathematical braille codes (Nemeth and Unified English braille), which are not commonly used in most European countries.
Desmos also allows for the export of graphs to a braille embosser, enabling braille readers to physically feel the graph. Supported embossers include the View Plus Tiger VP Max and the Enabling Technologies Romeo 60 and Juliet 120. When incorporating Desmos into mathematics lessons, it is advisable to have an ICT professional instruct the braille readers in the fundamentals. For more information, please see the instructional guide for ICT professionals.
One advantage of using audible graphs is the ability to quickly grasp a global overview after some practice. On the other hand, it can be challenging to compare different parts of the graph, which is relatively straightforward when using tactile graphs. As a result, some braille readers choose to begin with audible graphs to gain an overview and then switch to tactile graphs for more detailed information.
To learn more about the possibilities for braille readers using Desmos, see their video showing accessibility features.
Here follow examples of how to introduce audible graphs in Desmos. Be aware that entered functions may be read out in a different manner than what the student is accustomed to.
Investigate the graphs of the linear function: y = 0,8x + 2
- Discuss the function with the students. Important terms are slope, intersection with x-axis, intersection with y-axis.
- Give the braille readers a tactile image of the graph, the sighted students a visual image.
- Write y = 0.8x + 2 in in the input field, expression 1 in Desmos.
- Press Alt + t, to activate the Audio Trace mode.
- Press h to get a sound representation of the graph in expression 1.
Explain to the students how to interpret the sound of a graph.
We trace along the graph from left to right. If you are wearing stereo headphones, you will hear the sound transition from the left ear to the right ear. The tone changes to indicate the vertical position of the graph. When the graph is below the x-axis (quadrants 3 and 4), some static is added into the audio to get a sense of the graphs position in the plane. Additionally, when the graph crosses the y-axis and moves to positive x-values (quadrants 1 and 4), the timbre of the tone changes. - Arrow right and left in Desmos to get a step-by-step sound representation.
- Press Tab or Shift + Tab, to move between and listen to the interesting points of the graph.
- Discuss the relation between the sound and the visual/tactile features of the graph.
Present an audible graph to the students and ask them to explain what kind of graph it is. Start with very simple ones.
Explore the graph of the function y = x^2 + 5
- Write y = x^2 + 5 in in the input field, expression 1.
- Press Alt + t.
- Press h to get a sound representation of the graph in expression 1. You will hear a brighter tone when the graph slopes positively and darker tone when it slopes negatively.
- Arrow right and/or left to get a step-by-step sound representation.
- Press Tab and Shift + Tab or shift tab to jump between the graph’s interesting points (maxima, minima, and intersection points).
- Press x if you want to repeat the value of the x-coordinate in a point.
- Press y if you want to repeat the value of the y-coordinate in a point.
Find the intersections between the graphs y = x + 1 and y = x^2
- Write y = x + 1 in 3 in expression 1.
- Press arrow down.
- Write y = x^2 in expression 2.
- Press Alt + t.
- Press h to get a sound representation of the graph in expression 2.
- Press Tab or Shift + Tab, you move between and listening to the interesting points of the graph.
- Select “Intersection with expression at…”.
- Answer:
“Intersection point at (-0,618 ; 0.382)”
“Intersection point at (1,618 ; 2,618)”

Two intersecting graphs in Desmos
Table of Values
If finding exact values is paramount, it is advisable to use a table instead of a graph. Aligning the x- and y-values on the same line will make it easier for the braille reader to find the correct information in the table. When working with tables with many rows and columns, it is important to simplify the layout and assist the braille reader in locating the specific cells they need.
Sometimes, vital graph information, such as the zero(s) of a parabola or the asymptotes of a hyperbola, may not be immediately apparent in a table. In such instances, it is advisable to include this information. Refer to the table below for an example. Further guidance on creating tables for braille readers and reading tables with a screen reader can be found in the instructional guide for ICT professionals.
Function: y = 3x^2 ‐ 2x
Zeros: (0; 0) and (2/3; 0)
Minimum: (1/3; ‐1/3)
| x | y |
|---|---|
| ‐3 | 33 |
| ‐2 | 16 |
| ‐1 | 5 |
| 0 | 0 |
| 1 | 1 |
| 2 | 8 |
| 3 | 81 |
Verbal Description
Verbal descriptions are frequently used and depend on various factors, including the assignment’s objectives, the teacher’s and braille reader’s level of proficiency, and whether the description serves to complement, repeat or substitute an audible or tactile graph.
In general, commence by offering a verbal overview of the graph before exploring the details. Use precise mathematical terminology adapted to the braille reader’s skill level and knowledge. Equally important is instructing and practicing this as an alternative to having the braille reader independently create a tactile graph. The braille reader’s description also provides valuable insight into the mathematical comprehension: Has the braille reader formed the correct mental image? Is appropriate mathematical vocabulary being used?
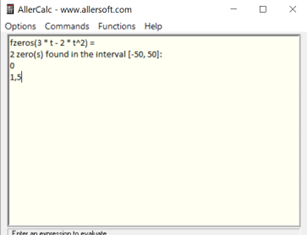
AllerCalc
It can be challenging to determine the (exact) points of intersection through touch or hearing. AllerCalc, a scientific calculator accessible to all students, calculates intersection points. For instance, the function “fzeros(3 * t ‐ 2 * t^2)” calculates the intersection point of f(x) = 3x and g(x) = 2x^2.
Using Programming for Exploring Functions
To be able to use programming to explore functions, the braille reader needs a fundamental understanding of how to operate a text-based programming environment. See more about this in the instructional guide on computational thinking for ICT professionals.
The braille reader should use a pre-made code created by the math teacher, rather than learning how to code in a specific programming language. This primarily involves the ability to navigate within the area where the code is located, to edit function expressions, and to run the code effectively, reaching the point where the results are presented.
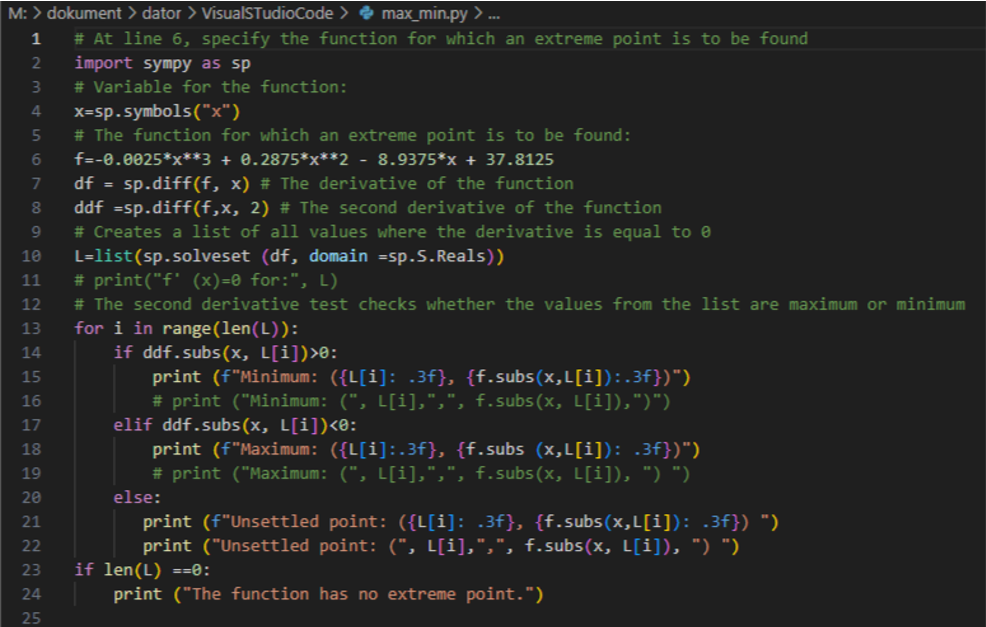
This is an example of a Python code, pre-made by a math teacher, where the braille reader just adds the function into the code and then runs it. In this example the function y = ‐0,0025x^3 + 0,2875x^2 ‐ 8,9375x + 37,8125 is added at line 6: