Introduction to Desmos
The graphical calculator in Desmos has many of the same features as the graphical part of GeoGebra. However, Desmos has the advantage of providing support for screen readers, which GeoGebra does not. Desmos also offers audio representation for the graph.
When Desmos is used in combination with a screen reader, the braille reader receives additional information about specific points along the graph, such as the coordinates of intersections. The braille reader can enter a function expression, and the corresponding graph will be displayed in the graph window.
When navigating along the graph using arrow keys, the screen reader will provide information about the coordinates of intersections. Keyboard shortcuts are also available to read intersections and other relevant points. The Desmos website contains a full list of accessibility commands.
It is important for the braille reader to learn how Desmos presents text on the braille display, as this may differ from the notation they are used to. Desmos only support Unified English braille (UEB) or Nemeth code. Function expressions are also verbally provided by the program when the screen reader is used. Be aware that the output from the speech synthesis may differ from how the expressions are pronounced in spoken language. Help may be needed from the teachers or professionals if the braille reader encounter difficulties in checking or correcting a function expression in Desmos when they cannot verify it on the braille display or exactly understand the output from the speech synthesis.

Navigation in Desmos
Before introducing Desmos to the braille reader, it is a good idea to test it out yourself. This will help you become familiar with navigation and to understand how to listen to the graph effectively. Once a function has been entered into Desmos, you can use the Audio Trace Command (Alt + t) and then press h to listen to the graph. The graph is played from left to right. If you are wearing stereo headphones, you will hear the sound transition from the left ear to the right ear. When you reach the middle of the visible part of the coordinate system in the window, you will hear an equal amount of sound in both ears. After that point, you will start to hear more in the right ear.
Another change that occurs is that the sound of the graph becomes brighter, indicating a higher pitch, as you move higher in the coordinate system, corresponding to more positive y-values. As the graph moves down, the sound becomes darker, resulting in a lower pitch.
If the graph is below zero on the y-axis, you will also notice some background noise (static). This is to indicate to the braille reader when you are on the negative side of the y-axis and when you cross over to the positive side.
In addition, when the graph crosses x = 0 and moves to positive x-values, the timbre of the sound changes. This auditory feedback provides the braille reader with valuable information about the characteristics of the graph and its behavior in the coordinate system.
In Audio Trace mode, instead of listening to the entire graph by pressing h, you can also use the arrow keys to move step by step through the coordinate system, listening to the coordinate point and the sound of the graph at the same time. Press Tab or Shift + Tab, to move between and listening to the interesting points of the graph (intersections, max/min) Pressing Escape returns the focus to the function expression, allowing you to edit the function.
To learn more, see the video showing accessibility features in Desmos.
- Discuss the function with the braille reader. Important terms are slope, intersection with x-axis, intersection with y-axis.
- Give the braille readers a tactile image of the graph.
- Write y = 2x + 3 in the input field, expression 1 in Desmos.
- Press Alt + t, to activate the Audio Trace mode.
- Press h to get a sound representation of the graph in expression 1.
- Explain to the students how to interpret the sound of a graph. Listen to the graph several times. If having a tactile graph, point out how the sound differs in different quadrants:
We trace along the graph from left to right. If you’re wearing stereo headphones, you will hear the sound transition from the left ear to the right ear. The tone changes to indicate the vertical position of the graph. For this particular graph the tone gets brighter and brighter.
When the graph is below the x-axis (quadrants 3 and 4), some static is added into the audio to get a sense of the graphs position in the plane. Additionally, when the graph crosses the y-axis and moves to positive x-values (quadrants 1 and 4), the timbre of the tone changes.
You can change the speed in which the graph is played. This is done by pressing Alt + (1-5), where 1 is the slowest speed. - Arrow right and left in Desmos to get a step-by-step sound representation.
- Press Tab or Shift + Tab, to move between and listen to the interesting points of the graph. You can also use the command i or Shift + i to move between interesting points. For this linear function, the interesting points are the intersections with the axes. The screen reader will read out loud each coordinate, when in focus.
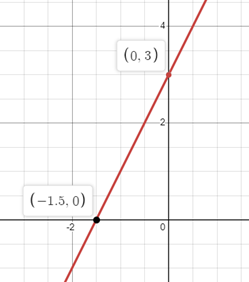
A linear graph in Desmos
- First, write y = x^2 in the input field, expression 1.
- Press Alt + t.
- Press h to get a sound representation of the graph in expression 1. Listen to the change in tone when moving down (negative slope) and up (positive slope). If helpful for the braille reader, use a tactile graph of the function when listening to the graph.
- Arrow right and left to get a step-by-step sound representation.
- Press tab or shift + tab to jump between the graph’s interesting points (maxima, minima, and intersection points).
- Press x if you want to repeat the value of the x-coordinate in a point.
- Press y if you want to repeat the value of the y-coordinate in a point.
- Press Escape to move back to the input field, and change the expression to y = -x^2.
- Press h to get a sound representation of the graph in expression 1. Listen to the change in tone when moving up (positive slope) and down (negative slope).
- Write y = x + 1 in the input field, expression 1.
- Press the down arrow.
- Write y = x^2 in the input field, expression 2.
- Press Alt + t.
- Press h to get a sound representation of the graph in expression 2. Two short “pops” will sound when the graph for expression 2 cross the graph in expression 1.
- Press Tab or Shift + Tab, to move between the interesting points of the graph.
- When an intersection occurs, the screen readers speech synthesis will announce “Intersection with expression one at x equals -0.618 y equals 0.382”, “Intersect and extreme point at x equals 0, y equals 0” and “Intersection with expression one at x equals -1.618 y equals 2.618″.
