This list contains a selection of learning resources that can be used when working with coordinate systems and graphs in class.
Jump to:
Braille Embossed Paper
It is useful to be able to print coordinate systems and graphs if you have a braille printer and the necessary software. Certain printers can simultaneously print visual print along with the embossed braille. See the guide on producing tactile coordinate systems and graphs for more information.

Swell Paper
Coordinate system and graphs printed on swell paper can become tactile illustrations after putting them in a swell machine. These illustrations can be combined with visual elements which makes them suitable for collaboration with sighted students. See the guide on producing tactile coordinate systems and graphs for more information.
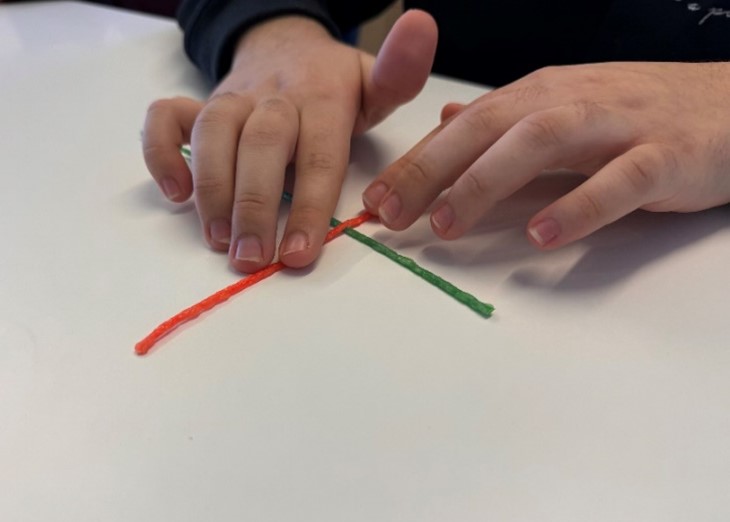
Wikki Stix
Wikki Stix are flexible rubber sticks that can be bent in different ways and by pressing them against the surface, they can be fixed.
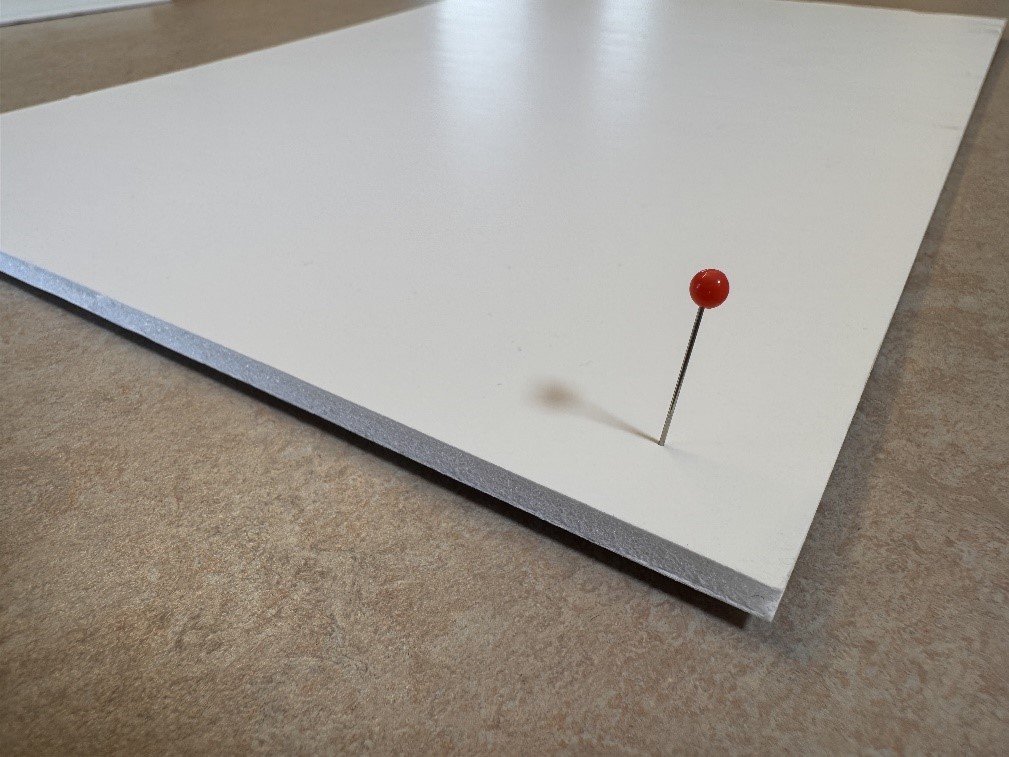
Cork Board
A cork board can be useful as a base for a swell paper or embossed picture, as pins can be securely attached to the surface, providing clearer markings for points.

Kapa Line
This plate, similar to a cork board, can be placed under a piece of swell or embossed paper, enabling the attachment of pins to mark points in the coordinate system.
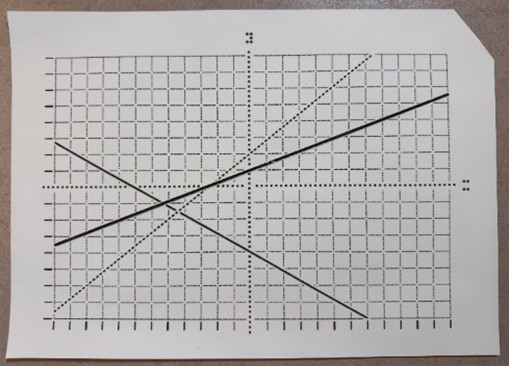
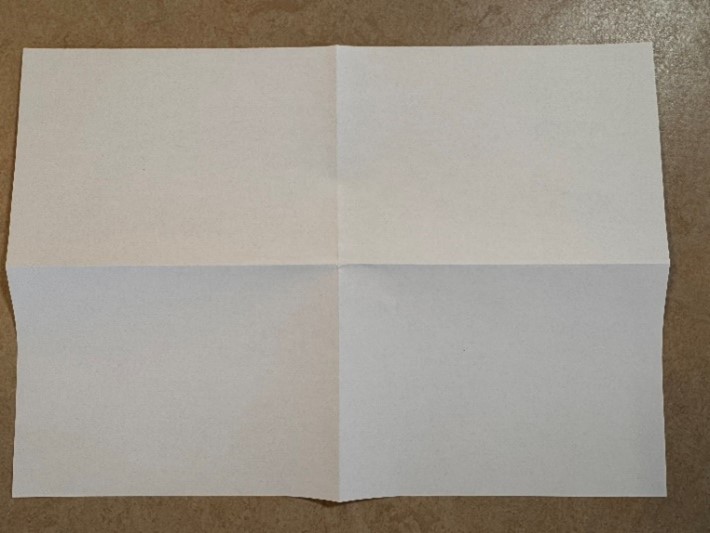
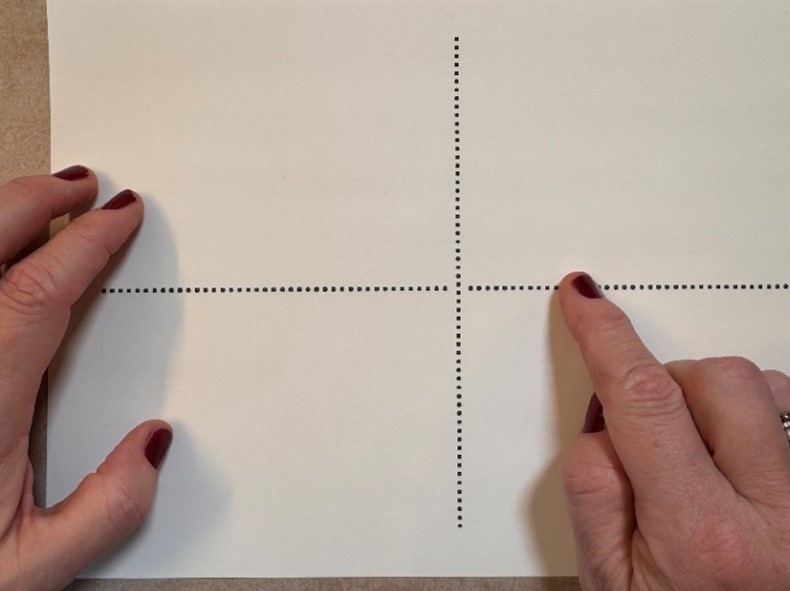
Stripped Coordinate System
A stripped coordinate system does not contain a grid or numbers. This type of coordinate system can be used to teach a braille reader about the axes and quadrants.
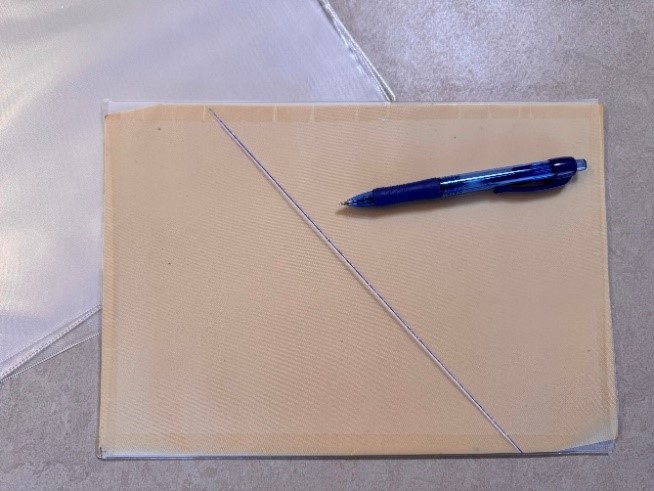
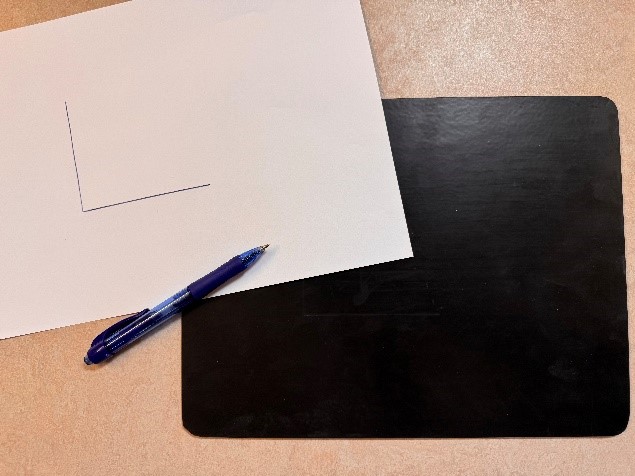
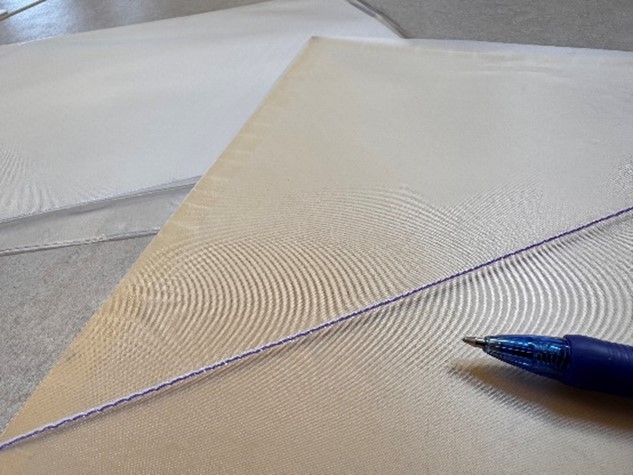
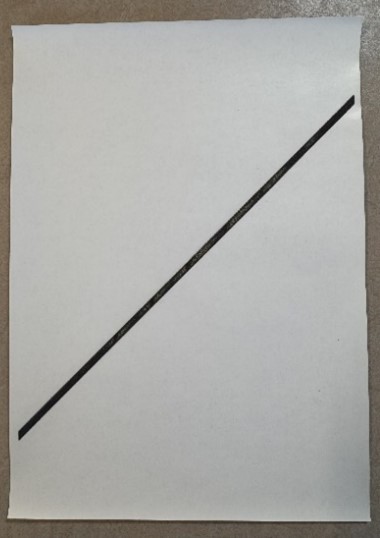
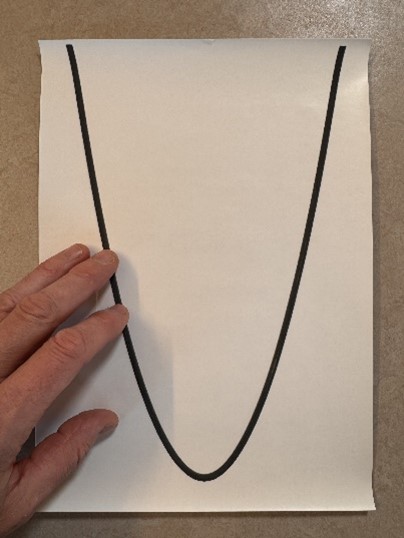
Blackboard and Rubber Board
On a Blackboard or a rubber plate, it is possible to quickly create custom coordinate systems and graphs that the braille reader can read. Drawing with a ballpoint pen on ordinary paper on a Blackboard or on plastic paper on a rubber board will give raised tactile lines on the paper. Lines marked on a rubber board are thicker and clearer than lines on a Blackboard.

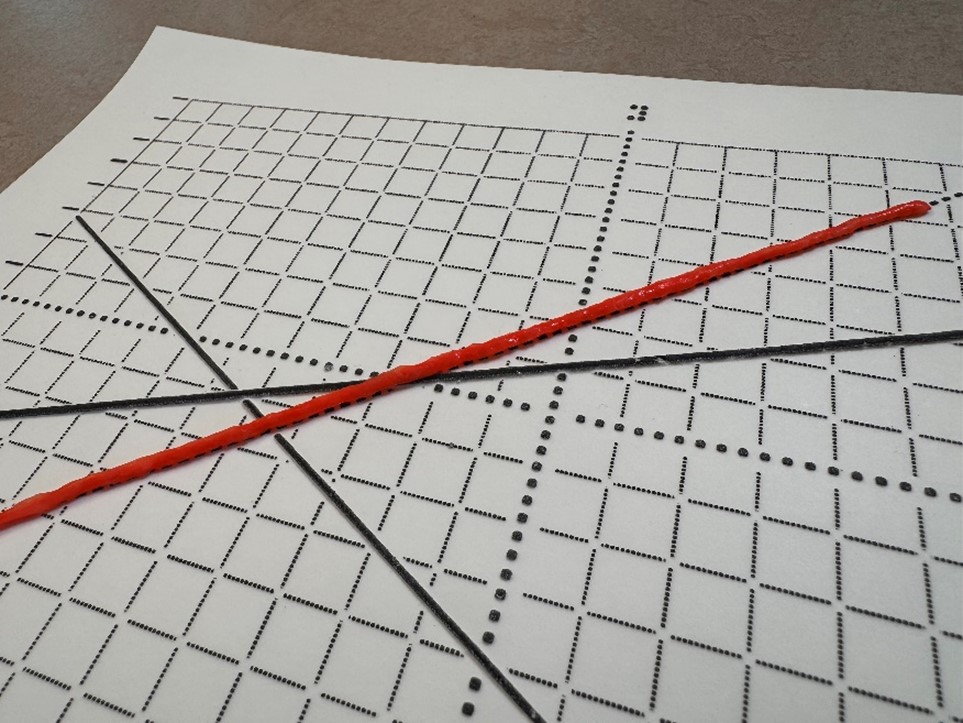
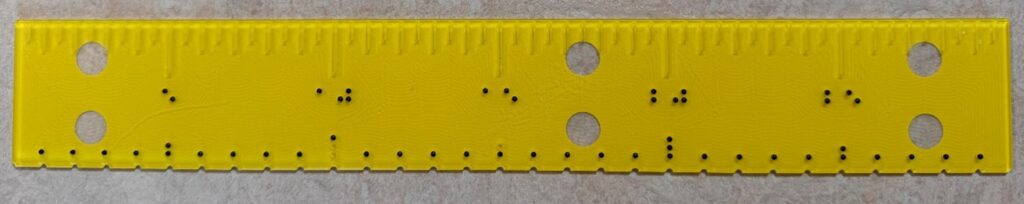
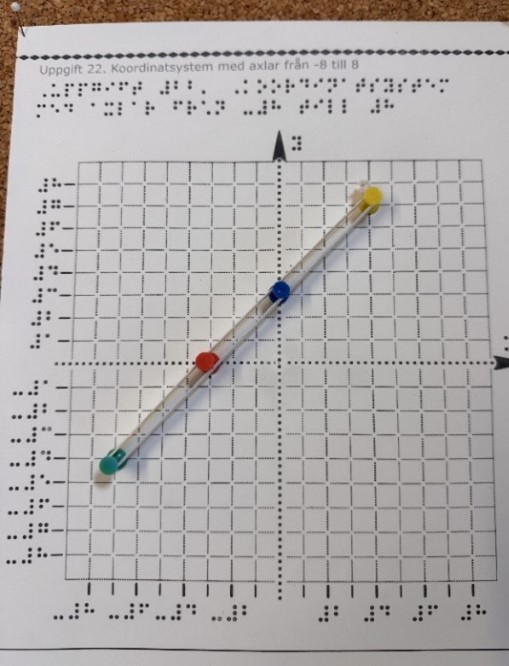
Ruler
With a ruler or stick, the braille reader can investigate whether a set of points creates a linear graph. The tactile ruler can be an advantage when the braille reader is familiar with it.
Tracing Wheel
A tracing wheel will also draw a dotted tactile line on paper or plastic paper. It is an advantage to use slightly thicker paper, and the drawing must be drawn mirrored on the back of the sheet.

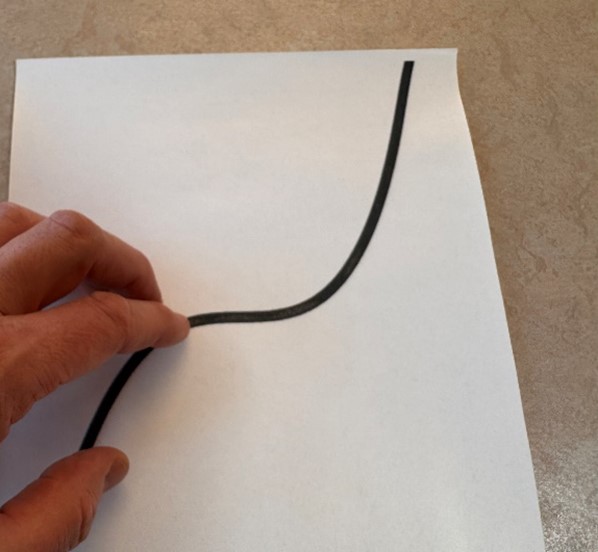
Tactile Graphs
It is possible to create your own tactile graphs in various ways, using Wikki Stix, pipe cleaners, wooden sticks, rubber bands, or a flexible curve.
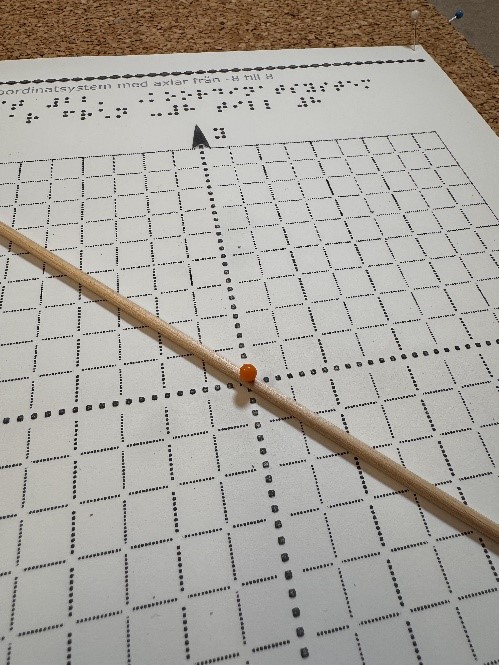
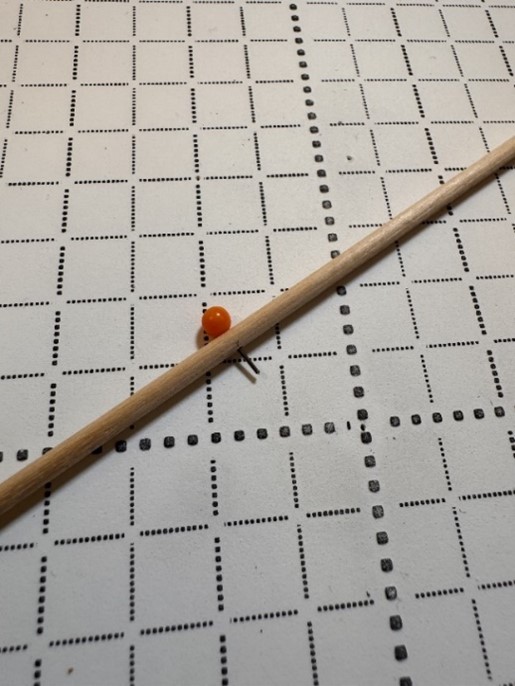
Wooden Stick
Prepare the stick with a hole so that it can be fixed in place with a pin.
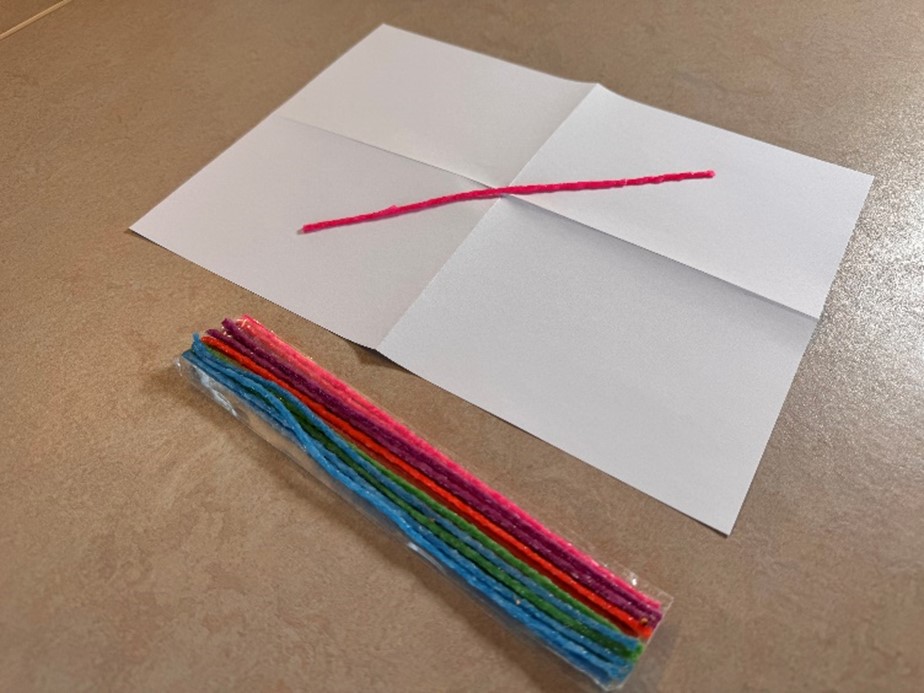
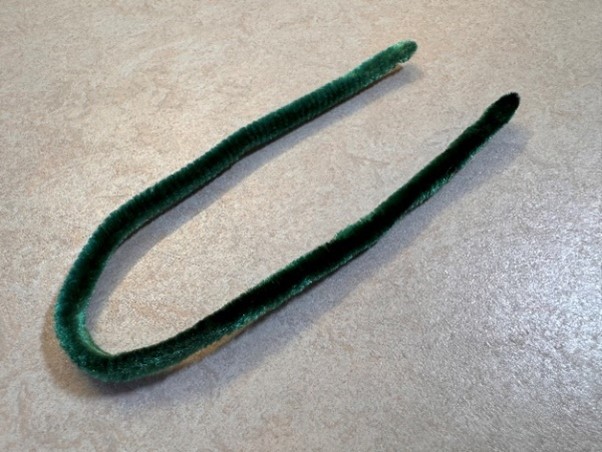
Pipe Cleaner
With a pipe cleaner, you can shape various types of graphs.
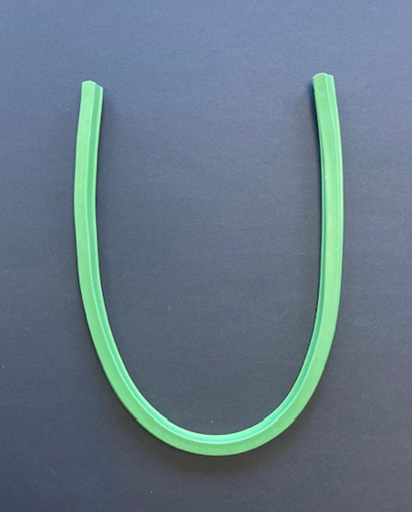
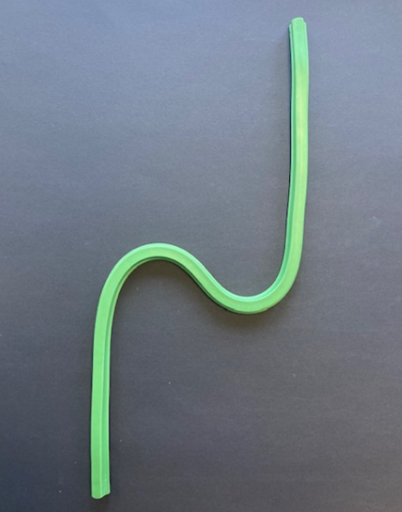
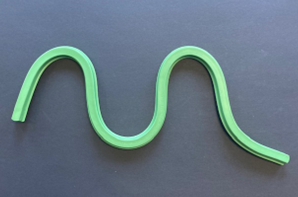
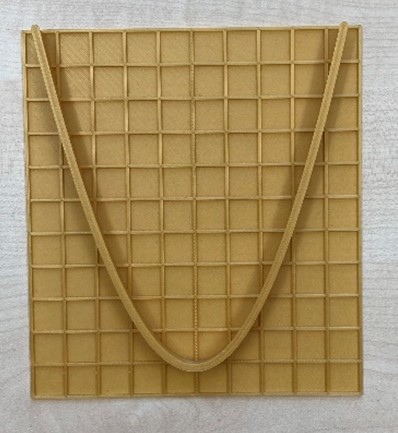
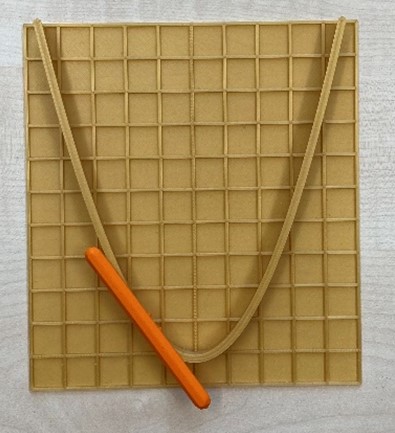
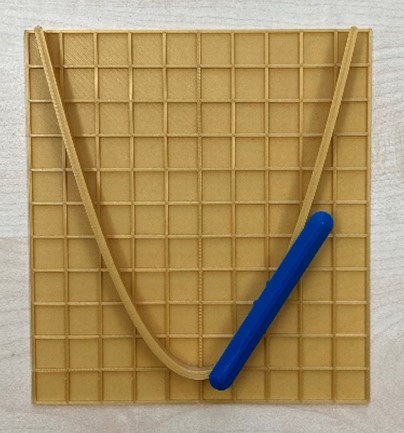
Flexi Curve
The flexible curve is larger than a pipe cleaner. By bending the flexible curve to the desired shape, you can create different types of graphs.
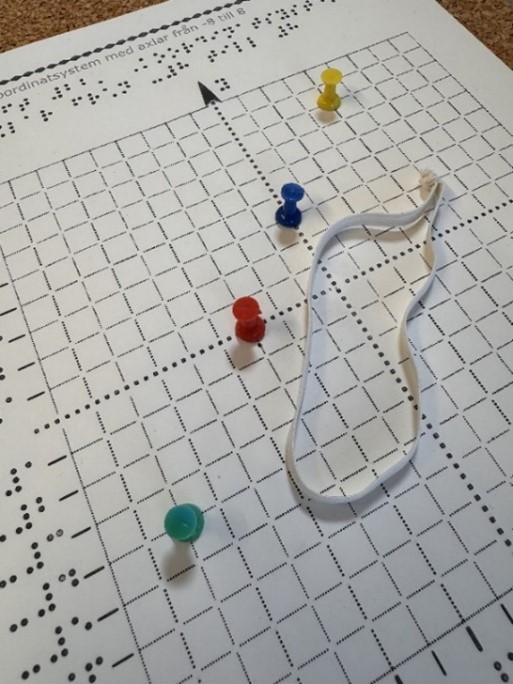
Rubber Band
With a rubber band you can connect points reinforced with pins.
3D-Printable Material
With a 3D printer, you can create simple materials that can help the student understand the coordinate system. If you have a 3D printer you can print ready-made coordinate systems from the download section. The advantage with some of the materials is that they can have a clear distinction between the elements. Consider the contrast between colors of 3D materials when designing for braille readers with residual sight.
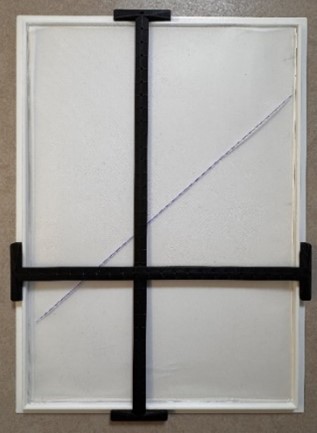
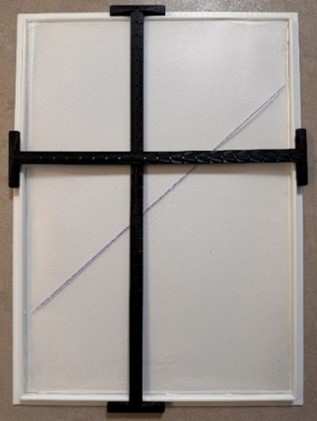
Coordinate System With Adjustable Axes
A coordinate system with adjustable axes is a tool for teaching and understanding the basics of the coordinate system, and translations of graphs.
Tangent
Using a 3D-printed tangent can effectively demonstrate how the slope changes as it moves along the graph.
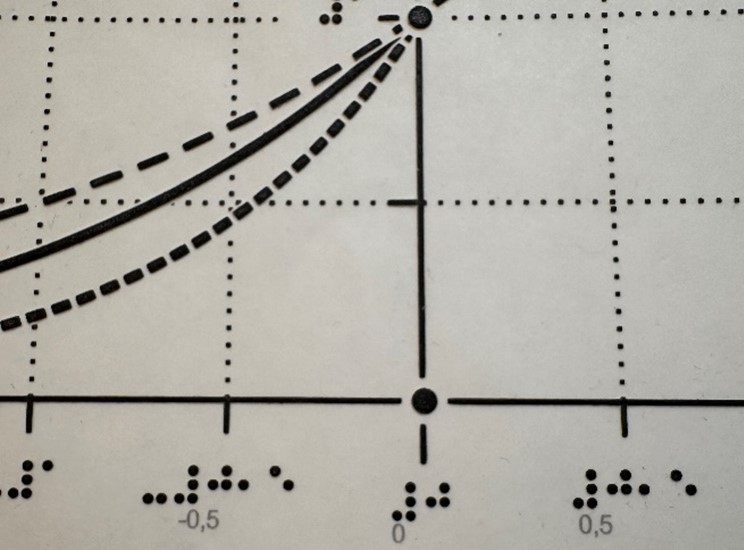
Standard Graphs
Standard graphs can be downloaded from the download section. You can choose to print them in embossed format, on swell paper, or in 3D. The embossed graphs are available in two versions. One version is without axes and grids, providing a clear, simplified view ideal for gaining an initial understanding of a specific type of graph. The other version includes a grid, making it suitable for use with the adjustable coordinate system to practice transformations. Ready-made textual descriptions of all standard graphs can be downloaded from the same section page.

Right: A specific parabola in a coordinate system with axes and grid.

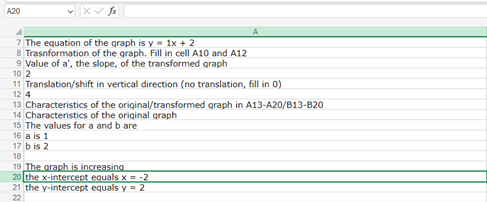
Excel
The student can use Excel to read or create tables. The program can also be used to obtain information about various types of graphs (quadrants, slope, maximum and minimum points, intersection points). This assumes that the teacher creates ready-made files where the student inputs different parameters.

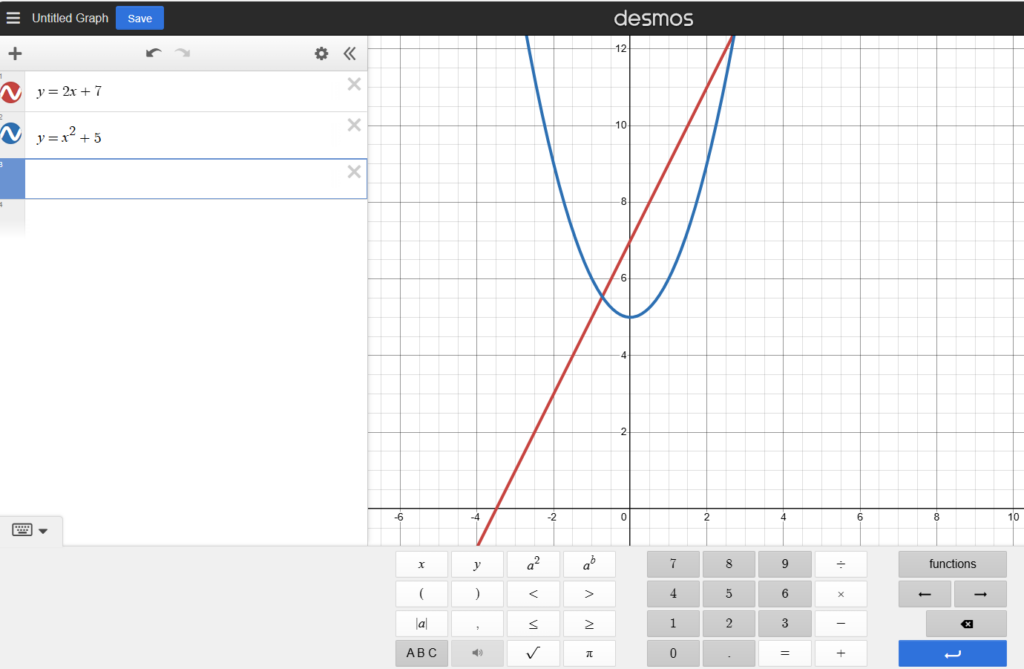
Desmos
The graphical calculator in Desmos offers features similar to GeoGebra’s, but with added screen reader support, lacking in GeoGebra. The braille reader can input functions for Desmos to display corresponding graphs. It is then possible to hear an audio track of the graph, facilitating the student’s comprehension of the graph’s overall structure. It is possible to get detailed audio and braille information on points like intersections and intercepts. Desmos has the ability to exports graphs to embossers, aiding physical exploration, and to calculates intersection points.
Braille readers should be supported by an ICT professional for Desmos. Additional guidance is available in the guide for ICT professionals.